Current migration trends from and within Asia
Debates and news coverage on migration from Asia often focus on forced migration from countries in political or humanitarian crises. As the statistics demonstrate, migration from and within the Asian continent is a diverse phenomenon, that includes migration for a wide range of purposes and is characterized by large migration flows within the region.
While migrants from Asia are making up a large part of global migration, the region is not at the centre of migration debates or reporting in Europe, thereby providing a skewed perspective on the multifaceted phenomenon of international migration. Countries of origin get very limited coverage in the European media in general, and if they do, reports are limited to the countries of origin of internationally displaced people [1]. While refugees from Syria and Afghanistan [2] did account for a large percentage of forcibly displaced people globally and in Asia, refugees from these countries are only a small fraction of the total numbers of Asian migrants. It is therefore important to consult current statistics, to get a better understanding of the nature and scope of migration to, from and within Asia.
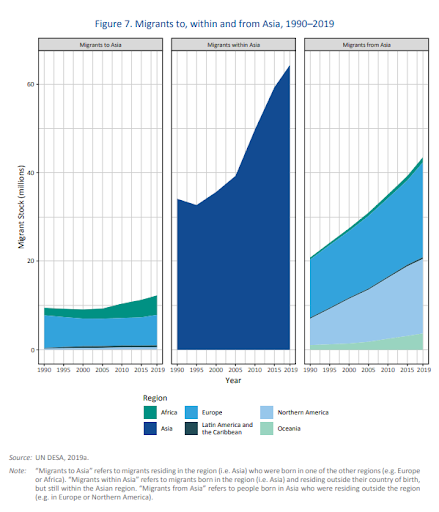
As highlighted in the World Migration Report 2020 of the International Organization for Migration, Asia[3] has been the place of origin of more than 40 percent of international migrants in the year 2019. Out of 111 million migrants from Asia, more than 50 percent (about 66 million people) migrated to other countries within Asia. Migration is a common practice on the continent, which increased over time. The data of migration flows from 1990 to 2020 shows a steady increase in migration from Asia, with the sharpest rise of migration happening within the continent itself (rising from 35 million to 66 million), as shown in the graph below (Figure 7, World Migration Report). In comparison, migration to Asia from other regions (such as Europe or Africa) only increased marginally. The largest number of people (in absolute numbers) came from the countries with the highest population, India and China (International Organization for Migration, 2019, pp. 68–70). However, compared to the total population of India (1.3 billion) and China (1.4 billion) the number of international migrants originating from India (17.5 million) and China (10.7 million) is relatively small.
Asian migration to Europe
The European Commission’s Atlas of Migration provides an overview of migration statistics to and from the European Union. As demonstrated in the report, migration to the EU from Asia comes in many forms and has many purposes including migration for work, education, family reunification and asylum. The overall number of (first time) issued residence permits in the EU remained relatively constant in the years 2016 and 2017 (around 870 000 permits were granted), with a slow decline in 2018 (850 000 permits) and 2019 (780 000 permits). The percentage of residence permits issued for educational purposes increased from 15 percent to 20 percent. Family related residence permits also increased from 25 to 30 percent, as did work permits, increasing from 11 percent to 23 percent. Other permits (including permits based on refugee status, for humanitarian reasons, unaccompanied minors and victims of human trafficking) were issued less often in comparison, decreasing from 49 percent to 27 percent (Tarchi et al., 2020, p. 238).
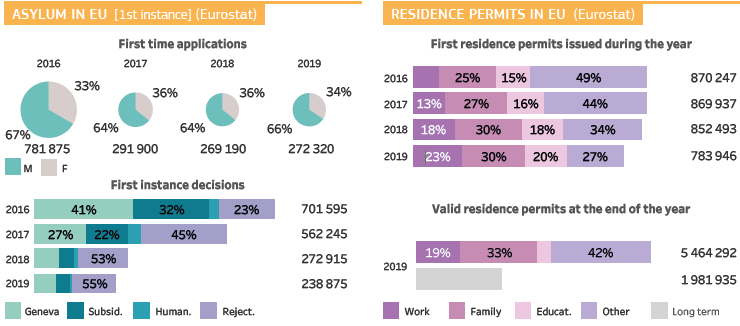
Asylum applications decreased drastically from over 780 000 applicants in 2016 to around 270 000 applicants in 2019. Asylum seekers in the EU from Asia [4] have been predominantly male with percentages of around 65percent male and 35 percent female in the years 2016 until 2019 [5]. While the male/female ration rarely changed (maximum 67 percent to minimum 64 percent male applicants) the number of total asylum applications decreased. Furthermore, the percentage of rejected asylum claims (in the first instance) increased: 23 percent of asylum applications were rejected (in the first instance) in 2016, comparted to 55 percent in 2019.
These numbers and statistics provide a very broad overview of migration dynamics from Asia to Europe and don´t tell us about the lived experience of migrants on an individual or local level. However, they are a good starting point to observe changes and continuities in migration flows, which can raise interesting questions for more in-depth quantitative and qualitative research on migration.
More detailed statistics on migration to and from Asia, including country specific data, subregional data and migration data related to specific historic events, can be accessed online in the World Migration Report, in the Atlas of Migration or by consulting the Eurostat webpage.
Author: Melina Breitegger
Footnotes
[1] Based on a content analysis of 2417 news articles published in 16 European countries and the United States in the timeframe of 2015 and 2018, only 778 mentioned the country of origin of migrants: 293 articles discussed migration from Syria, 30 articles mentioned Myanmar, 18 articles discussed migration from Albania and Ukraine respectively, and 15 articles concerned migration from Afghanistan (Fengler and Kreutler, 2020, p. 29).
[2] In 2019, Syrians continued to be the largest group of forcibly displaced people worldwide (13.2 million displaced people, of which 6.6 million were refugees and more than six million internally displaced people), followed by internationally displaced people from Venezuela (4.5 million) and Afghanistan (3 million) (UNHCR, 2020, pp. 8–9).
[3] Asia in this context refers to 49 countries in the following subregions: Central Asia, Eastern Asia, South-East Asia, Southern Asia and the Middle East.
[4] Referring to 48 Asian countries.
[5] The statistics on asylum applications by Asian migrants mirror a general trend of overall asylum applications to the EU. The numbers decreased from 1 167 075 first time applications in 2016 to 631 570 first time applications in 2019. The gender ration fluctuated between 68 to 62 percent male applicants and between 32 to 38 percent female applicants (Tarchi et al., 2020, p. 14).
References
Fengler, S. and Kreutler, M. (2020) Migration coverage in Europe’s media. A comparative analysis of coverage in 17 countries. Frankfurt/Main: Otto Brenner Stiftung. Available at: https://www.otto-brenner-stiftung.de/wissenschaftsportal/informationsseiten-zu-studien/studien-2020/stumme-migranten-laute-politik-gespaltene-medien/ (Accessed: 4 May 2021).
International Organization for Migration (2019) World Migration Report 2020. Geneva: International Organization for Migration. Available at: https://publications.iom.int/system/files/pdf/wmr_2020.pdf (Accessed: 4 May 2021).
Tarchi, D. et al. (2020) ‘Atlas of Migration – 2020’, in. Luxembourg: Publications Office of the European Union. Available at: https://publications.jrc.ec.europa.eu/repository/bitstream/JRC122942/aom_2020_online_final_v2.pdf (Accessed: 4 May 2021).
UNHCR (2020) Global Trends. Forced Displacement in 2019. Copenhagen: United Nations High Commissioner for Refugees. Available at: https://www.unhcr.org/be/wp-content/uploads/sites/46/2020/07/Global-Trends-Report-2019.pdf (Accessed: 6 May 2021).
Links
https://publications.jrc.ec.europa.eu/repository/handle/JRC122942
https://publications.iom.int/system/files/pdf/wmr_2020.pdf
Keywords
Migration, Asia, Europe, statistics